R Code Snippets
Table of Contents
R Code Snippets
Grouping and counting objects
Using table
df <- data.frame(name = c("a", "a", "a", "b", "b", "c", "c", "c", "c"), x = 1:9)
tt <- table(df$name)
tt
a b c
3 2 4
Using dplyr
library(dplyr)
df <- data.frame(name = c("a", "a", "a", "b", "b", "c", "c", "c", "c"), x = 1:9)
tt <- df %>% group_by(name) %>% summarize( count = n() )
tt
# A tibble: 3 × 2
  name  count
  <chr> <int>
1 a         3
2 b         2
3 c         4
ggplot2
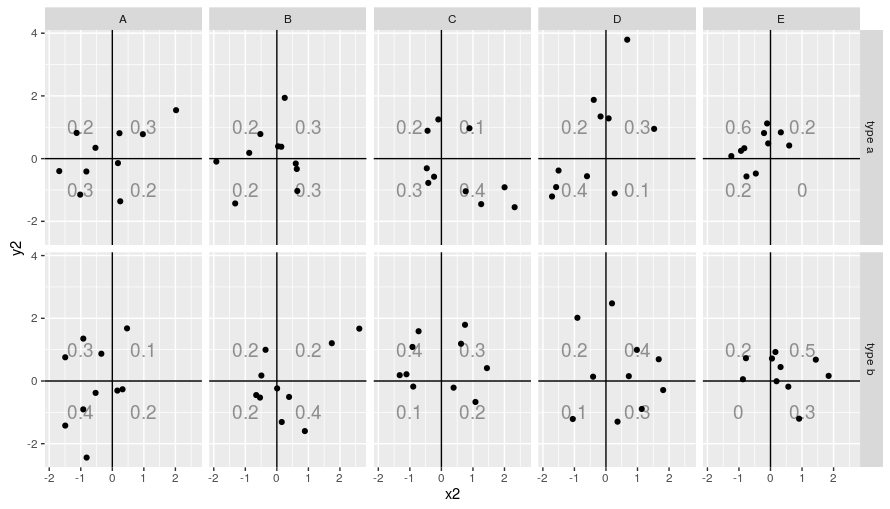
Adding labels in a multi-faceted graph
I originally wrote this code to answer a question on Stackoverflow. Another user was quicker than me (and provided a more beautiful answer) but I want to save my version.
df <- data.frame(
x2=rnorm(100),
y2=rnorm(100),
type = c(rep("type a", 50),
         rep("type b", 50)),
kind = rep(LETTERS[1:5],10))

library(ggplot2)
library(plyr)

quadrant_labels <- function(dat) {
  group_size = nrow(dat)
  lq1 <- nrow( subset( dat, x2 >= 0 & y2 >= 0))
  lq2 <- nrow( subset( dat, x2 >= 0 & y2  < 0))
  lq3 <- nrow( subset( dat, x2  < 0 & y2  < 0))
  lq4 <- nrow( subset( dat, x2  < 0 & y2 >= 0))
  data.frame(quadrant1 = lq1 / group_size,
             quadrant2 = lq2 / group_size,
             quadrant3 = lq3 / group_size,
             quadrant4 = lq4 / group_size )
}

labels <- ddply(df, c("type", "kind"), quadrant_labels)

ggplot(df, aes(x2, y2)) + geom_point() +
  geom_vline(xintercept = 0) +
  geom_hline(yintercept = 0) +
  geom_text(data = labels, x =  1, y =  1, aes(label = quadrant1), alpha=.40, size=5) +
  geom_text(data = labels, x =  1, y = -1, aes(label = quadrant2), alpha=.40, size=5) +
  geom_text(data = labels, x = -1, y = -1, aes(label = quadrant3), alpha=.40, size=5) +
  geom_text(data = labels, x = -1, y =  1, aes(label = quadrant4), alpha=.40, size=5) +
  facet_grid(type~kind)
Other sources of information
Cleaning the table
A small case study for tidyverse functions (separate, pivot_longer
and pivot_wider, among the others)