06 Aug 2011
How fast my git repositories are growing
I wrote a very small utility to gather LOC counts from a git repository. Called gitsloc, it's based on Cloc, with some extra goodness provided by Sysadm::Install (a rather inaptly named module, if you ask to me, but full of useful gems).
I guess it could actually have some uses, who knows?, but I wrote it mostly because I wanted to see how fast repos are growing, and R is the obvious tool to tinker with the results.
I'm less than a beginner with R, and I have to admit plotting data
from a multi-column CSV file is less straitghforward than I expected:
I had to use xyplot from the lattice package, like this:
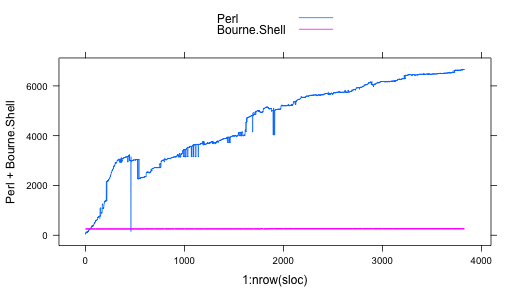
xyplot(
  Perl + Bourne.Shell ~ 1:nrow(sloc),
  data = sloc,
  type = 'a',
  auto.key = list( space = "top", lines = TRUE, points = FALSE)
)
Here the result, with data provided analysing the Dancer github repository (branch devel).