Posts tagged "dev":
My Emacs configuration changes in 2025
$ git diff tags/2024...tags/2025 --stat | ag changed
 38 files changed, 540 insertions(+), 409 deletions(-)
A list of the main changes (introducing or eliminating packages, structural changes, important changes in the interface).
0441b30 |
2025-01-04 | dired-subtree configuration |
4fc34aa |
2025-02-04 | switch to doom-tomorrow-night as default |
3100c81 |
2025-02-05 | + forge |
90dfc96 |
2025-02-05 | + org-sidebar |
5318eb6 |
2025-02-16 | switch to sqlformat |
6eddac8 |
2025-02-16 | + vertico + corfu + marginalia + orderless + consult |
291089c |
2025-02-16 | combo for consult-line |
0de118b |
2025-02-21 | trying treesit-fold instead of yafolding |
e54719f |
2025-02-21 | sideline + minimap (WIP) |
a030077 |
2025-03-07 | + colorful package |
bf09612 |
2025-03-08 | using hideshow instead of treesit-fold, more versatile |
801fddf |
2025-03-15 | git in fringes |
d91e87d |
2025-03-15 | Personalized fringe bitmap for Flymake |
1e56038 |
2025-03-15 | Integration with Ollama (Ellama) |
169efab |
2025-06-15 | minimal init messages |
f42b4b6 |
2025-06-20 | Jira integration (using auth-info) |
9000572 |
2025-09-17 | renamed larsen-ibuffer -> larsen-buffer; added bufferlo package |
eedc448 |
2025-09-19 | better configuration for the background |
4db8195 |
2025-10-08 | new work projects agenda view |
2c0cb99 |
2025-11-20 | Switch to Sly (from Slime) |
d65d153 |
2025-11-20 | more adjustments for Sly |
147e53c |
2025-11-20 | + embark |
1123bd1 |
2025-11-20 | setup for using and exporting GPX files |
8f2db38 |
2025-12-30 | extending image-dired to show image size |
An Emacs Lisp macro to parse arguments in shell scripts
My Emacs system sometimes creeps out into the shell. This usually happens when I want to provide an additional entry point to data I maintain using Emacs.
This means that in my ~/bin I have a few scripts, written in Emacs
Lisp, that are meant to be run from the command line, outside of an
Emacs client.
With that, it comes the need to parse command line parameters.
After writing the same code a couple of times, and since back then I
could not find an obvious other choice to do the same thing, I decided
it was a good use case for a macro, which I called with-positional-args.
Here how it looks like in user-space. This is part of a script I use to search into annotated PDFs in a directory:
#!/usr/local/bin/emacs --script

;; ... omissis ...
;; (preparing load-path and requiring a couple
;; of features, including the one that implements
;; with-positional-args)

(defun pdf-search (pattern path)
  ;; the details are irrelevant in this context
  )

;; Here we go!
(with-positional-args ((pattern :mandatory "You must provide a PATTERN")
                       (path :default "."))
  (pdf-search pattern path))
And here the implementation:
;; Caveman args list parsing
(defun arg-resolver (arg-properties idx)
  (pcase (car arg-properties)
    (:default
     `(or (nth ,idx command-line-args)
              ,(cadr arg-properties)))
    (:mandatory
     `(or (nth ,idx command-line-args)
          (error (or ,(cadr arg-properties)
                     "Undefined error"))))
    (_ (nth idx command-line-args))))

(defmacro with-positional-args (arglist &rest body)
  "Bind command-line arguments as per ARGLIST, then evaluate BODY.

Each element of ARGLIST has the form: (VAR) for optional argument, (VAR
:default VALUE) for specifying a default value when missing, (VAR
:mandatory [MSG]) for required arguments with optional error message
MSG."
  (declare (indent 1))
  `(let ,(cl-loop for (arg-name . arg-properties) in arglist
                  for idx from 3
                  collect `(,arg-name ,(arg-resolver
                                        arg-properties idx)))
     ,@body))
rando-planner v0.2
I created a 0.2 release for rando-planner.
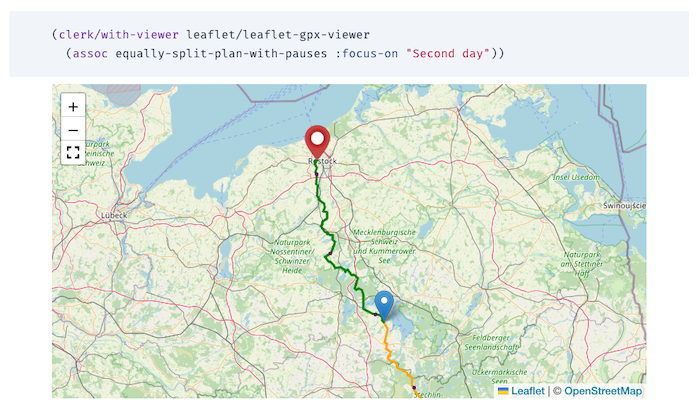
What's Changed
- Different colors https://github.com/larsen/rando-planner/pull/50
- markers (circles) every N km https://github.com/larsen/rando-planner/pull/56
- Option to configure average-speed day by day https://github.com/larsen/rando-planner/pull/57
- Detail leaflet viewer https://github.com/larsen/rando-planner/pull/58
- Fullscreen button https://github.com/larsen/rando-planner/pull/66
- Support for user defined markers https://github.com/larsen/rando-planner/pull/67
Reactions and follow ups
- Adam Rice mentions a project that has features in common: Best Bike Split
How I use :dbconnection in org files
In the post "Followup on secrets in my work notes" Magnus Therning mentions a feature in Org Babel I contributed to (in ob-sql.el, to be more precise).
You can see my old post for details about that feature, but basically,
the patch allows one to use a :dbconnection header argument in a
source block to reference a connection defined in
sql-connection-alist.
The question in Magnus' post is a signal somebody is actually using this feature, so I am pleased. Perhaps I should also follow up, describing how I use this feature in my workflow. This will constitute another example of how to manage secrets.
I use Org, among other things, to keep work "lab notes" that usually contain SQL queries on different databases.
At work, pretty much all databases are Postgresql or Redshift, and I
keep connection details in ~/.pgpass, following this format:
In other words, every DB definition is made of two lines: the first is a comment, with the name of the database (with no spaces); the second contains the actual connection details.
In my Emacs configuration, then, I have this function:
(defun get-connection-alist (filename)
  "Gets PG connections details from ~/.pgpass file (FILENAME)."
  (with-current-buffer (find-file-noselect filename)
        (let ((lines (split-string (buffer-string) "\n" t)))
          (when lines
            (cl-loop for (k v) in (seq-partition lines 2)
                  collect (cl-destructuring-bind (host port db user password)
                              (split-string v ":" nil)
                            `(,(replace-regexp-in-string "^#\s+" "" k)
                              (sql-product 'postgres)
                              (sql-port ,(string-to-number port))
                              (sql-server ,host)
                              (sql-user ,user)
                              (sql-database ,db)
                              (sql-password ,password))))))))
and
(setq sql-connection-alist (get-connection-alist "~/.pgpass"))
I use Emacs in daemon mode and it's not unusual Emacs to stay up for
weeks, so I also have an automatic way to incorporate .pgpass changes,
using filenotify.
(file-notify-add-watch
 "~/.pgpass" '(change)
 (lambda (evt)
   (setq sql-connection-alist
         (get-connection-alist "~/.pgpass"))))
Reactions and follow ups
- Andreas Gerler describes his approach and setup here: Emacs and SQL
Exporting content from org-roam to arbitrary org files
I adopted org-roam to collect and manage my personal notes. I also use Org for managing the pages of my personal website (this site). My notes are mostly personal, as I said, but sometimes I want to publish them on the website.
So far the process has been manual: when I had significant updates to publish I just copied text from one org file (in org-roam) to another. But I wanted something more systematic.
I therefore added this two functions in my Emacs configuration
(defun my/remove-org-roam-links (buffer-as-string)
  (replace-regexp-in-string
   "\\[\\[id:.*\\]\\[\\(.*\\)\\]\\]" "\\1" buffer-as-string))

(defun my/paste-org-roam-node (initial-input &key no-links)
  (interactive)
  (let* ((file (org-roam-node-file (org-roam-node-read initial-input)))
         (raw-buffer (with-current-buffer (find-file-noselect file)
                       (goto-char (point-min))
                       (buffer-string))))
    (if no-links (my/remove-org-roam-links raw-buffer)
      raw-buffer)))
Then I can use a snippet like this in the destination buffer
#+begin_src emacs-lisp :results value raw append
  (my/paste-org-roam-node "through" :no-links t)
#+end_src
And this appends to the file the contents of the original org-roam note (I happen to have a note titled "Through the Language Glass", so that 'through' is enough to identify a node), after stripping, if requested, the links to other notes.
There's still some manual work to do before one can post, but this solution is already an useful improvement.
TODO
[ ]the operation is not idempotent[ ]org-roam-node-readstill requires the user to hit return in the minibuffer to confirm the choice. I'd rather have no interaction after invoking the command byC-C C-C[ ]after the note content is appended to the file, there's some clean up to do: removing unwanted metadata from the original buffer, and so on…[ ]it seems there are problems with the management of footnotes, if present in the original note
Switching from stream to blog
I wanted to transform my stream for a long time, switching from a single .org file where I kept adding things, to a more appropriate blog structure, with individual posts, index, archive, tag pages, a feed and so on. Thanks to Org, it was relatively easy to use the original material to produce the files I then fed to org-static-blog.
Here the code I used (I just omitted a few service functions)
(defun split-org-file (input-file output-dir)
  "Split an .org file into separate files for each top-level entry.
INPUT-FILE is the path to the .org file.
OUTPUT-DIR is the directory where the separate files will be saved."
  (with-current-buffer (find-file-noselect input-file)
    (goto-char (point-min))
    (org-map-entries
     (lambda ()
       (let* ((entry-title (nth 4 (org-heading-components)))
              (tags (parse-tags-into-filetags
                     (nth 5 (org-heading-components))))
              (ts (get-timestamp-from-title entry-title))
              (entry-title-stripped (strip-entry-title entry-title))
              (output-file (expand-file-name
                            (format "%s.org" (dirify-string entry-title-stripped))
                            output-dir)))
         (let ((body (org-copy-subtree))
               (cleaned-body (with-temp-buffer
                               (insert (car kill-ring))
                               (goto-char (point-min))
                               (when (re-search-forward "^\\*+ \\(.*\\)$" nil t)
                                 (replace-match "" nil nil))
                               (buffer-string))))
           (with-temp-file output-file
             (insert (format "#+title: %s\n" entry-title-stripped)
                     (format "#+date: %s\n" (or ts "2000-01-01"))
                     (format "#+filetags: %s\n" (or tags ""))
                     "\n\n"
                     (format "%s" cleaned-body))))))
     "LEVEL=1")))
rando-planner
The tool I am building to plan multi-day bike events is coming together. Now one can obtain a map with markers that are automatically placed based on the data in the plan data structure.
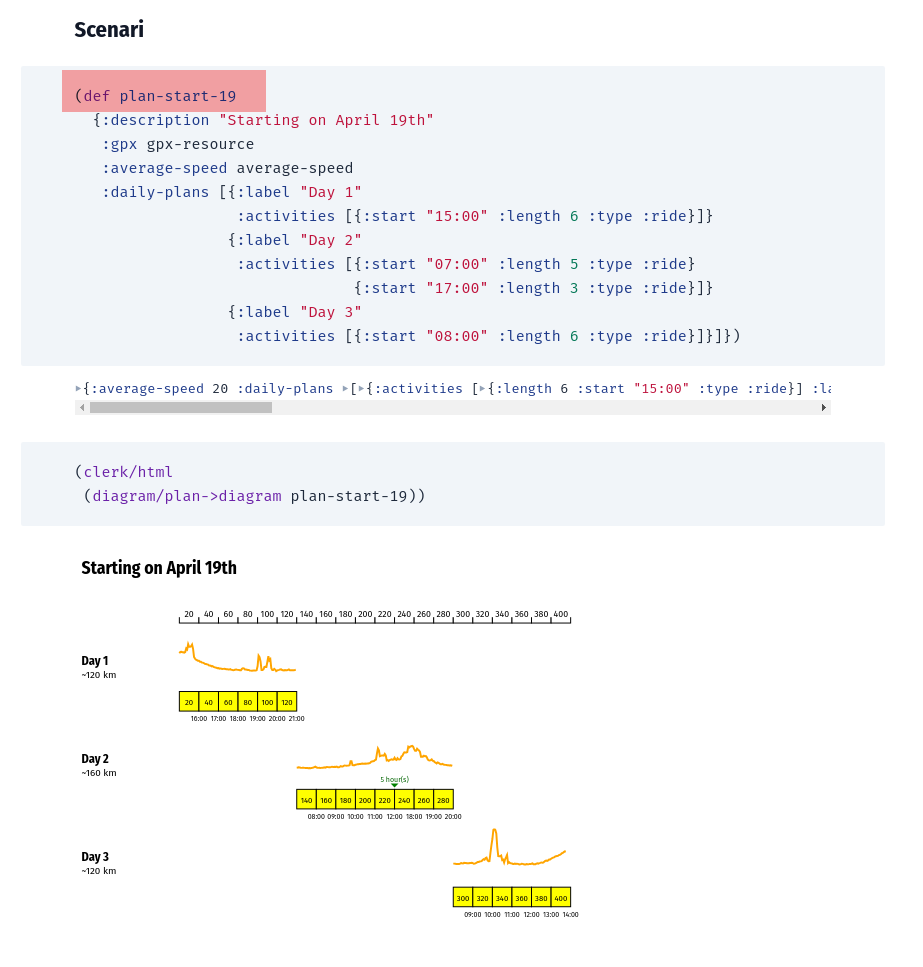
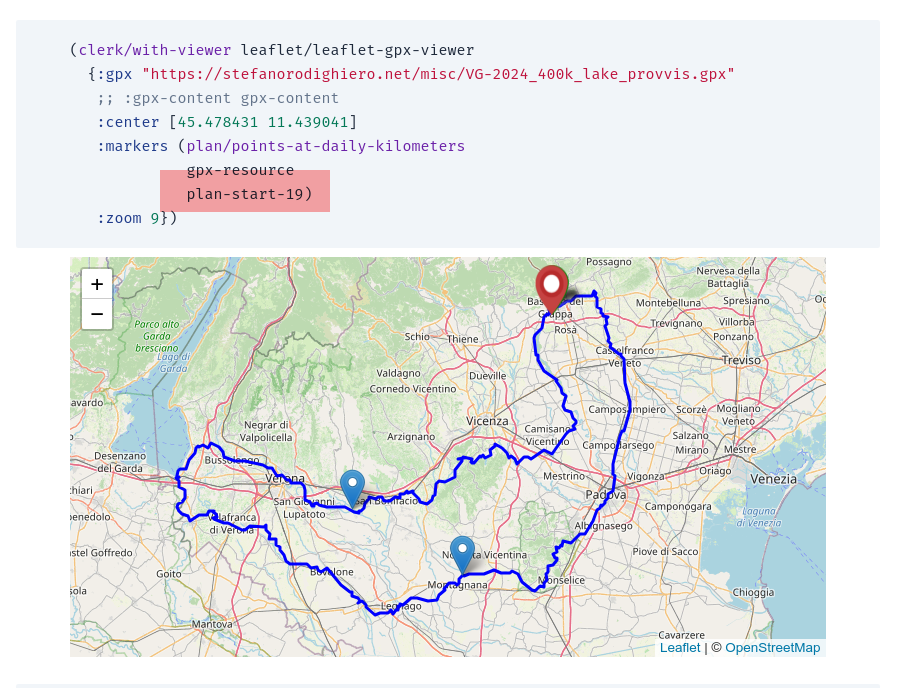
Using Clerk to plan bikepacking events
I have been experimenting with Clerk to build a tool I can use to study different strategies for Venetogravel 2024. Inputing parameters such as the distance I have to cover, the average speed I think I can maintain during the event, and how I intend to distribute the effort over several days, I can obtain a diagram. It's a work in progress, here what I got so far:
(def plan-start-19
{:description "Starting on April 19th"
 :daily-plans [{:label "Day 1"
                :activities [{:start "15:00" :length 6 :type :ride}]}
               {:label "Day 2"
                :activities [{:start "07:00" :length 5 :type :ride}
                             {:start "17:00" :length 3 :type :ride}]}
               {:label "Day 3"
                :activities [{:start "08:00" :length 6 :type :ride}]}]})
which results in
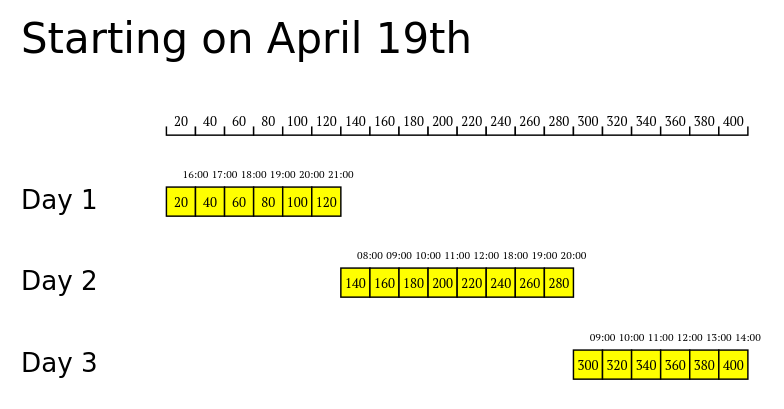
To do:
- integrate data from GPX files (altitude is fundamental)
- learn how to rotate entities with SVG (transformations seem to work in the least intuitive ways)
Some experiments with Pharo
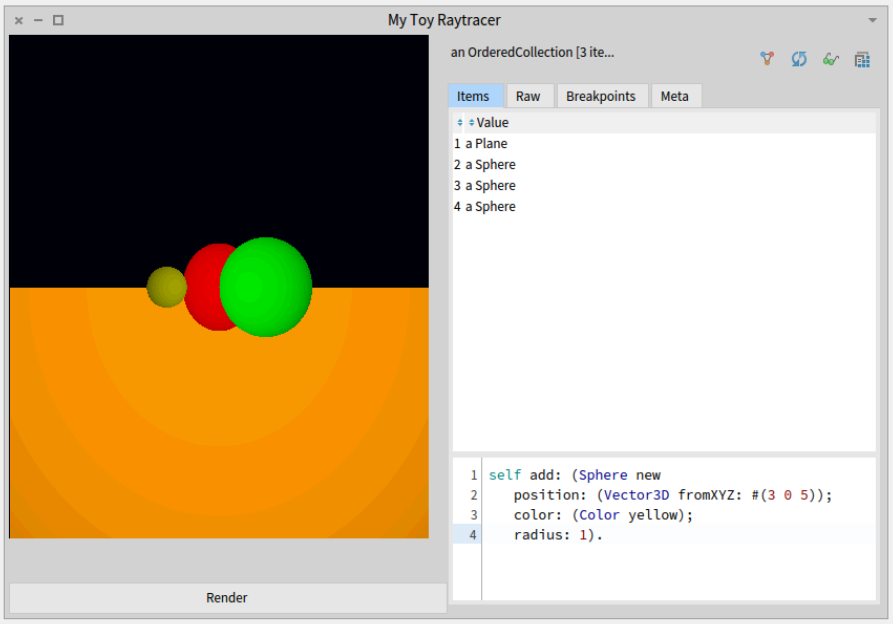
Cool that it is so easy to include an inspector in the GUI:
defaultLayout

  | rt |
  rt := Raytracer new.
  rt scene: (Scene demo).

  ^ SpBoxLayout newLeftToRight
    add: (SpBoxLayout newTopToBottom
      add: (SpMorphPresenter new morph: (rt imageMorph));
      addLast: (SpPresenter new newButton label: 'Render';
        action: [rt render] ) expand: false;
      yourself);
    add: (StInspector new model: (rt scene objects) );
      yourself
A patch for Org Babel
Org-babel allows SQL snippets to be run on a database connection that
can be specified in the source block header using parameters such as
:dbhost, :dbuser, :dbpassword and so forth.
This is very useful, but I'd also like to be able to use symbolic references to connections defined elsewhere, so that for example one does not have to specify the password every time, interactively or, worse, in the .org file itself.
I am also a user of sql.el, that provides a custom variable
sql-connection-alist, where users can define a mapping between
connection names and connection details.
The patch I submitted extends the behavior of org-babel-execute:sql so
that it's possible to specify a new param :dbconnection containing a
connection name, used for looking up sql-connection-alist.
PyData Berlin 2018
First Python conference I attend.
The venue is in the complex of Charité – Universitätsmedizin Berlin: Forum 3 is a nice building and has also some space outdoors (fortunately the conference days were blessed by sun and a nice temperature).
- First keynote was not strictly related to Python or data science/engineering. It was an extremely interesting, fun and in some moments moving account of the hacker scene in Romania before the collapse of Ceaușescu's regime in the eighties. The story of the COBRA was particularly interesting (COBRA is a Romanian clone of ZX Spectrum, the result of a remarkable process of reverse-engineering, glorious stubborness and sometimes not-strictly-legal work-arounds).
- Next I attented Five things I learned from turning research papers into industry prototypes. A practical collection of advices if you are tasked with the mission of converting some "theory" from a paper into something executable. Apparently a problem the audience could relate to a great deal. You can find the slides here.
- Simple diagrams of convoluted neural networks seemed interesting, but unfortunately the presentation was hard to understand to my ears. Anyway, I managed to extract some value from it, mostly because the arguments led me to think about the general problem of devising a notation for expressing and describing a complex system (like a NN): it should make the reader able to follow the process step by step, it should make it easier to spot errors in the system, it should adhere consistently to the metaphor –if any– it decides to follow, it should pay attention to representing clearly what and how it's combined in the various phases of the process, and it should be dynamic (so apparently trying to represent neural networks using a static diagram is a lost cause?). The speaker said that the baseline is currently very low, and there's much space for improvement. The slides.
- Compared to the previous talk, Launch Jupyter to the Cloud: an example of using Docker and Terraform was very basic but very well presented. The lesson is you can use Terraform and Docker to completely describe (thus making it really reproducible) the entire configuration needed for an experiment (being it some data analysis task, a Jupyter notebook, things like that). The slides.
- I was particularly excited about the talk coming after the lunch break: Let's SQL Like It's (NOT) 1992! The main point of the speaker is that writing SQL is usually a skill one learns in college, then it's only rarely refreshed and kept up to date with the improvements to the standard. Also, SQL is frequently thought only as a query language, but it actually includes a data modeling language and a data definition language. The presentation was compelling and well delivered (it was actually a live coding session), but unfortunately James run out of time and had to stop abruptly and pass the podium to the next speaker before arriving at the most interesting parts of his talk. He promised to put the code on github. Besides a couple of idioms I didn't see before the talk, I discovered a seemingly useful extension for PostgreSQL, allowing users to implement bitemporal tables automatically (so that it's possible to have usual CRUD primitives, and still be able to reconstruct the state of the dataset at any given time).
- Next talk was A/B testing at Zalando: concepts and tools. A researcher from Zalando illustrated the tools (and the mindset) they adopted for conducting A/B tests. An endevour they took very seriously, apparently, as they dedicated 3 BE Engs + 3 FE Engs + 4 Researchers + 3 Product managers = 13 persons to it. They developed an internal tool called Octopus and released a OS Python library called ExPan for statistical analysis of randomised control trials. Highlights: one of the attendees asked what are common pitfalls when developing A/B tests. According to the speaker, one is testing too many variables at once (he said they're developing techniques to automatically detect variable "interference" in A/B experiments, such as frontend variations that can reciprocally hinder each other). Another common error is stopping the experiment too early (for example because management wants answers faster), leading to results that have no statistical relevance. He also stressed the point that stats and probability form only half of the picture: business stakeholders need to be involved from the very beginning (e.g. How much running an experiment cost?)
- Frankly, I chose next talk because I had headache, the other ones in this time slot seemed a bit above my head so I chose something simple: Solving very simple substitution ciphers algorithmically. It was about a toy problem (automatically decyphering mono-alphabetic substitution codes) so nothing new, but what I liked very much is that the speaker was a mathematician, and it was a pleasure following the terse, ordinate and precise explanation ("Let me first name and define a few things").
- The second keynote of the first day was about GDPR. It was a nice round up from the point of view of the legislator, explaining the principles (old and new) underlying the regulation. The juicy part came during the Q&A afterwards, according to me. First question was about a practical problem that might rise in the context of ML: what if some data a user decided to let the controller store is used to train a model, and then the same user asked for that data to be deleted? Is the model still valid? The speaker explained this is out of the scope by GDPR, it's an open question and she would be interested in reading a paper about that if someone would bother to write one. Second question was a bit of a critique: GDPR is endangering small startups and grassroot association that don't have the resources to implement what's needed for complying with the regulation: the speaker said it's a common problem and added that in her opinion the time (two years, more or less) we had to prepare for GDPR was not very well spent: we should have a platform allowing anyone to comply with GDPR using ready tools. We're not there yet.
- Last of the first day was the lighting talks session. I particularly like this formula: very brief (5 minutes) but intense talks about various topics, useful for those that had no time to prepare a full fledged about their idea. The most interesting was the "Don't trust your data" talk: a Phd student discovered a dataset about chemical compound skin penetration, used since the 60s is incomplete, yet used over time in many research endevours (such as training 20+ ML models). He went back to the original papers illustrating the dataset, discovered many more features were available, and published a new refined dataset. Certainly a lesson in questioning your input. End of first day.
- Second day opened with a keynote: Fairness and Diversity in Online Social Systems.
- Next, mobile.de (an Ebay company) presented the architecture and the tools they use to offer their users a personalized web experience, and specifically to infer future users' behaviour using a stream of events describing their usage of the website. They started using Hive (with Jinja2 to generate SQL queries) but then switched to (Py)Spark, gaining a 5x time improvement and, according to their judgement, a much easier system to understand. They didn't publish the slides but I found some pointers on one of the speakers' personal website: “Which car fits my life?” - mobile.de’s approach to recommendations.
In Going Full Stack with Data Science: Using Technical Readiness Level to Guide Data Science Outcomes Emily Gorcenski suggested we could use NASA's TRL (a scale used by engineers to measure progress of technology) adapting it into a "Data Science Readiness Levels" scale. Here the original scale, with a possible translation for software products and for data science projects.
TRL Product Data Science Basic principles observed Need or shortcoming identified Algorithm design & development Technology concept formulated Technology concept formulated Data explored and described Experimental proof of concept Tests written Experimental proof of concept Technology validated in lab Tests passing on dev machines Algorithm validated against sample data Technology validated in relevant environment Tests passing in develop Algorithm validated against production data Technology demonstrated in relevant environment In QA Algorithm integrated in develop Prototype demonstrated in relavant env. Beta version in limited staging Prototype demostrated in operational env. System complete and qualified QA passed and ready for staging System complete and qualified System proven in operational env. System running in production System proven in operational env. She proposed the idea of "full-stack teams" (opposed to full-stack devs, unrealistic if one has to take seriously the amount of knowledge modern system engineering encompasses), and the fact that data science / data analysis is inseparable from the other facets of a software project, since its inception.
- In Data versioning in machine learning projects Dmitry Petrov started from what I think is a very common problem: we have good tools to manage code versioning, but the same can't be said about versioning data. More generally, he stated that while hardware development has a well established methodology (Waterfall), and software development has one as well (Agile/Scrum), the same can't be said for data related projects. He presented a tool he's developing called DVC, an extension to git (similar to git-annex in some aspects) specifically designed for managing large volumes of data.
- Big Data Systems Performance: The Little Shop of Horrors by Jens Dittrich was in large part a tirade against the over-hyped terms like "Big Data" &co, that often bring more confusion than clarity when it comes to evaluate a solution for a data related problem. This lack of clarity hinders reaching an efficient solution, because of the mix of three "dimensions" that should instead be orthogonal (as the name Dittrich chose suggests): 1. fancy sounding buzzwords, 2. technical principles and patterns, 3. software platforms. He dismissed the first as good only for marketing (he apparently had a bad opinion about marketing), he said being familiar with 3 is important, but even more important is knowing very well 2, because those principles are ubiquitous and more solid. He brought a real life example, where he obtained a 10000x speed improvement applying different patterns and tools from the already existing solution.
First experiences with Python
At the new job I use Python for my programming tasks. Currently developing some data related stuff (ETL and reporting) and a web service, trying to organize the stuff I write so that it can be used by other members of the team for other projects. I will register a few impressions:
- Overall, I like the syntax. More specifically, I like the fact there are very few principles that uniformly apply in many situations. Most of the time I can "invent" the way something has to be written and it usually turns out as the right form.
- I like the ecosystem I've seen so far: pandas is a great tool, for example. I'm struggling with SQLAlchemy, but I never quite liked ORMs anyway.
- I am trying to follow PEP8, even if I have quite different ideas at least about aestethics in code (first time I run pylint on a script I scored -8.61/10).
- I didn't quite get yet the way modules are organized on the file system.
- I feel the documentation lacks regularity and completeness. I can find a lot of tutorials about any topic, but I still could not find a systematic source to use as a reference.
Update
Speaking of great tools in the Python ecosystem, I just discovered Jupyter received the ACM Software System Award. Congratulations!
eyebrowse
I started using eyebrowse more systematically. I tend to have multiple frames scattered around my xmonad workspaces, but I usually also have a workspace exclusively devoted to a fullscreen Emacs frame, and there I usually work on different projects, that require different windows configurations. So eyebrowse is useful. To be able to switch more confortably from a configuration to another, I added this little piece of code to my setup:
(loop for i from 1 upto 9
      do (define-key eyebrowse-mode-map
           (kbd (format "M-%d" i))
           `(lambda ()
              (interactive)
              (eyebrowse-switch-to-window-config ,i))))
CEPL
This weekend I have been exploring CEPL: "a lispy and REPL-friendly Common Lisp library for working with OpenGL", as its author writes. I have no prior experience with OpenGL, but thanks to Baggers' video series "Pushing pixels with Lisp", and predating the examples I found, I managed to write some working code. I have a project idea in mind, let's see how it ends up.

A couple of remarks if you're inclined to experiment on your own.
- When I started I was not able to run
cepl:repl, due to the OpenGL version exposed by my driver (3.0, whereas the mininum for CEPL is 3.1). But that's not the actual version supported by the hardware. To access the real capabilities, and ultimately to be able to run CEPL, you must ask explicitly, for example(cepl:repl 800 600 3.1); I initially missed that, so I spent time trying to solve the wrong problem. I work with xmonad. The default tiled windows positioning is not ideal with the CEPL output window, but thankfully CEPL's window is easy to identify at
manageHooklevel by its title. So I added this in my configuration:<+> (title =? "CEPL" --> doFloat). For example:myManageHook = manageDocks <+> (title =? "CEPL" --> doFloat) <+> manageHook defaultConfig
hledger-dupes is now in hledger
Simon Michael asked me to include hledger-dupes in the main hledger repo.
Scheme interpreter going on
I spent part of the weekend on my Scheme interpreter implementation, after a long hiatus. Cleaned up some code, and started enstablishing the grounds for adding closures (thus passing from the substitution model to the environment model of evaluation, a profound change).
Writing a test library for Common Lisp
Writing a test library for Common Lisp
New page, with some notes about the ongoing process of writing a test library for CL (just a toy project, I'm not going to spoil the ecosystem).
The System Paradigm
I have used a REPL connected to a production system to change code. Yes, I have changed code in a running production system. Does that terrify you? Honestly, it kind of terrifies me a little, too! Regardless, sometimes the best way—the only way—to diagnose a particularly nasty bug is to poke a living organism and observe the result. I am more like a doctor diagnosing a patient and less like a detective trying to piece together a sequence of events from the clues left behind.
There's that and plenty of fascinating observations about the difference between a system constructed as a organism (system paradigm), and constructed as a cathedral (or a pyramid: that's the language paradigm).
I am fascinated, but I'd like to talk to someone who had this kind of experience. I understand the beauty and the utility of the REPL, yet intervening in a system in such a organic and (apparently, to me) not organized fashion seems more dangerous than it's compelling. How one can ensure the changes applied to the running deploy will be incorporated in the code base? How can you properly "undo" the changes you've made while you were tinkering with the system. Anyway, a nice and inspiring post.
ELisp refactoring tools
Started working on tools to help me refactor Elisp code. Here the first main function:
(defun create-new-function (function-name)
  "Creates a new function definition, given a selection. Removes
  the selection and replaces it with a call to the newly created function"
  (interactive "sFunction name: ")
  (let ((code (get-region)))
    (progn
      (save-excursion
        (progn
          (move-to-empty-point)
          (insert-new-function-definition function-name code)))
      (insert "(" function-name " )"))))
Comments welcome.
Automatic webjump list from org
Webjump is a bookmark facility for Emacs. Fed with a list of bookmarks (as an association list) it presents a menu, then open a browser page with the selected link. Simple and handy.
This function converts my list of bookmarks (expressend in a org document that is also used to build my Links page) in a data structure suitable for webjump.
(defun get-webjump-sites ()
  (with-current-buffer (get-file-buffer "~/Dropbox/stefanorodighiero.net/links.org")
    (delq nil
          (mapcar
           (lambda (i)
             (let ((item-string (cdr (assoc "ITEM" i)))
                   (regex "\\[\\[\\(.*\\)\\]\\[\\(.*\\)\\]\\]"))
               (if (posix-string-match regex item-string)
                   `(,(match-string 2 item-string) . ,(match-string 1 item-string)))))
           (org-map-entries 'org-entry-properties nil 'file)))))

(setq webjump-sites (get-webjump-sites))
Update
I asked for a review on #emacs, bpalmer kindly pointed out a few things that should be done in a different manner:
- I'm building a list containing nils, which I need to delete later
(
delq). I shouldn't be creating them in the first place - Probably no need for
posix-string-matchinstead ofstring-match - I should provide a docstring
So, here a better version, using the loop macro
(require 'cl)
(defun get-webjump-sites ()
  "converts a org document in a data structure suitable for webjump"
  (let ((regex "\\[\\[\\(.*\\)\\]\\[\\(.*\\)\\]\\]"))
    (with-current-buffer (get-file-buffer "~/Dropbox/stefanorodighiero.net/links.org")
      (loop for i in (org-map-entries 'org-entry-properties nil 'file)
            for item-string = (cdr (assoc "ITEM" i))
            if (string-match regex item-string)
            collect `(,(match-string 2 item-string) . ,(match-string 1 item-string))))))
It's more concise and direct, definitely better, but I'm still not satisfied: it lacks clarity and cleanliness.
R setup
I need to setup a R environment on the Linux machine. RStudio (which I'm currently using on my Mac) eases packages installation and at the same time provides a rich and pleasant to use environment, but I'm considering going for a different setup on my Linux machine. For example, one way could be using Debian packaged R plus Emacs ESS.
Adding dashboards to hledger
I spent a couple of days trying to hack some changes into hledger-web. I use it from time to time, especially to visualize the item tree generated from my journal, but I would need more to incorporate it in my workflow. What I would like is a system to describe arbitrary widgets to compose in a dashboard. Things like "monthly expenses, comparing this and last year, using a histogram". Or "breakdown of the top N expense categories, using a pie chart".
So far, I just built some familiarity with the codebase and I managed to obtain a static (I mean, non-configurable) dashboard with a single widget showing my monthly expenses. Like that (code is on github):
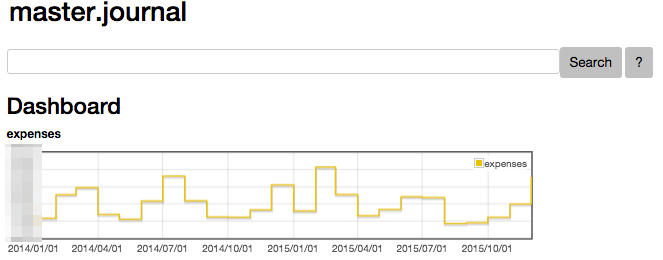
But the real problem is designing a sensible dashboard configuration language.
Logo-ish drawing environment
Some months ago I bought a copy of "Turtle Geometry". I am looking for a LOGO environment to follow along and do the exsercises, but I could not find anything good enough for Mac OS X (which is quite surprising, if you ask me). So I decided to write my own version. The first usable thing I produced is not quite LOGO, but enough to do fancy drawings and (I'm guessing) translate most of the exercises without efforts. Code is on github.

Update
One thing I'm not sure how I could do is the interactive environment, but I discovered I have something acceptable at no cost, thanks to how Lisp and the lispbuilder-sdl package work.
Here a piece of code from my project:
;; [...]
    (with-events ()
      (:quit-event () t)
      (:key-down-event (:key key)
                       (when (sdl:key= key :sdl-key-escape))
                       (sdl:push-quit-event))
      (:idle (reset-turtle)
             (fancy 20)
             (draw-turtle *position-x* *position-y* *direction*)
             (update-display)))))
Since we're implicitly using the :poll event mechanism, the :idle
event is triggered at each "game loop" iteration. Thus, if I redefine
the functions used in the body associated to the :idle event while
the program is running, I obtain a different drawing. What I do, at
the end, is:
- evaluate
(main)(the SDL window appear) - focus in the Emacs window
- edit some relevant functions (for example the body of
fancy) C-x C-eto re-evaluate the definition- voilà, new picture is drawn
lispbuilder-sdl
Tried to install listbuilder-sdl via quicklisp, but got stuck on cocoahelper dependency. Is it supposed to work on Yosemite?
Managed to install the library on a Linux virtual machine. Tried Asteroids to test it.
A neat tmux trick
Francesco showed me his tmux conf. This is particularly useful:
bind . send-keys B Space E Enter
hakyll deploy command
Hakyll allows users to configure a deploy command:
- http://jaspervdj.be/hakyll/reference/Hakyll-Core-Configuration.html
- An example: Switching from Jekyll Bootstrap to Hakyll
Next question is: how could I add more commands?
DateTime::Duration
Here a surprising feature in DateTime::Duration's API. What this code will print?
use strict;
use warnings;

use DateTime;
use DateTime::Duration;

my $dt1 = DateTime->new( year => 2015, month => 8, day => 1 );
my $dt2 = DateTime->new( year => 2015, month => 8, day => 31 );

my $duration = $dt1->delta_days( $dt2 );
print $duration->days();
It prints 2, because the days() method is implemented as
abs( ($duration->in_units( 'days', 'weeks' ) )[0] )
meaning that the duration is first converted to weeks, then the remainder is returned.
Here an extended piece of code to show what happens:
use strict;
use warnings;

use DateTime;
use DateTime::Duration;

my $dt1 = DateTime->new( year => 2015, month => 8, day => 1 );

foreach my $d ( 2 .. 31 ) {
  my $dt2 = DateTime->new( year => 2015, month => 8, day => $d );
  my $duration = $dt1->delta_days( $dt2 );
  printf "%s days and %s weeks\n", $duration->in_units( 'days', 'weeks' );
}
which prints:
2 days and 0 weeks
3 days and 0 weeks
4 days and 0 weeks
5 days and 0 weeks
6 days and 0 weeks
0 days and 1 weeks
1 days and 1 weeks
2 days and 1 weeks
… and so forth
If you want to know how many days there are between two given dates,
better be explicit and use $duration->in_units('days').
The doc explains it clearly if you take the time to read it:
These methods return numbers indicating how many of the given unit the object represents, after having done a conversion to any larger units.
But it's baffling to me nonetheless.
Light Up
Simon Tatham's Portable Puzzle Collection is a nice collection of puzzle games that should be interesting to solve automatically. I installed the Android version of the collection and played a little with Light Up.
You have a grid of squares. Some are filled in black; some of the black squares are numbered. Your aim is to ‘light up’ all the empty squares by placing light bulbs in some of them.
Each light bulb illuminates the square it is on, plus all squares in line with it horizontally or vertically unless a black square is blocking the way.
To win the game, you must satisfy the following conditions:
- All non-black squares are lit.
- No light is lit by another light.
- All numbered black squares have exactly that number of lights adjacent to them (in the four squares above, below, and to the side).
Non-numbered black squares may have any number of lights adjacent to them.
First thing, board representation and some diagrams code to obtain a graphical rendition.

import Diagrams.Prelude
import Diagrams.Backend.SVG.CmdLine

data Square = Empty
            | Box
            | Light
            | Lamp
            | Num Integer

type Board = [[Square]]

board :: Board
board = [[Empty, Box,   Light, Empty, Box,   Empty, Empty],
         [Empty, Empty, Light, Empty, Box,   Empty, Num 0],
         [Box,   Num 2, Lamp,  Light, Light, Light, Light],
         [Empty, Empty, Light, Empty, Empty, Empty, Empty],
         [Empty, Empty, Light, Empty, Empty, Num 1, Num 1],
         [Num 2, Empty, Box,   Empty, Empty, Empty, Empty],
         [Empty, Empty, Num 1, Empty, Empty, Num 0, Empty]]

squareSize = 30

drawSquare Empty = square squareSize
drawSquare Box = square squareSize # fc black
drawSquare Light = square squareSize # fc yellow
drawSquare Lamp = circle (squareSize * 0.3) # fc white
               <> square squareSize # fc yellow
drawSquare (Num n) = text (show n) # fc white # fontSize (Local 16)
                  <> square squareSize # fc black
drawBoard :: Board -> Diagram B R2

drawBoard b = vcat . map (alignR . hcat) . (map . map) drawSquare $ board

sketch = drawBoard board

main = mainWith sketch
ghci
ghci + Gloss don't play well on my system. I need to do
ghci -isrc -fno-ghci-sandbox src/Main
wiz
I wanted to do some progress on the Scheme interpreter, but I ended up instead fixing code that went on github by mistake, and fighting with some git nuisances.
Clojure IDE
Spent some time setting up a development environment for Clojure using Leiningen + Emacs + CIDER + clj-refactor. Still confused by some parts of the system but I can see how pleasant it can be.
Measuring things
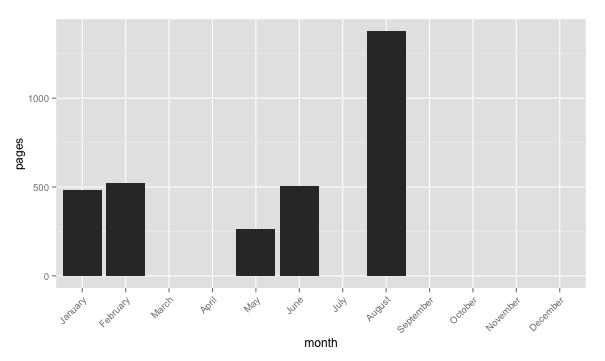
I use org-mode for registering the books I read. Here some code to produce stats.
;; Is there a better (more idiomatic) way to aggregate values?
(defun aggregate (aggregate-function lst)
  (let ((hash (make-hash-table :test 'equal)))
    (loop for key in (mapcar 'car lst)
          for value in (mapcar 'cdr lst)
          do (if (null (gethash key hash))
                 (puthash key value hash)
               (puthash key (funcall aggregate-function value (gethash key hash)) hash))
          finally return hash)))

(defun pages-per-month-raw ()
  (with-current-buffer (get-file-buffer "~/org/books.org")
    (mapcar (lambda (b)
              (let* ((month (format-time-string "%b" (date-to-time (cdr (assoc "TIMESTAMP" b)))))
                     (pages (string-to-int (cdr (assoc "PAGES" b)))))
                (cons month pages)))
            (books/in-year "2015"))))

(defun pages-per-month ()
  (let ((ppmr (pages-per-month-raw)))
    (aggregate '+ ppmr)))

(defun month-list ()
  '("Jan" "Feb" "Mar" "Apr" "May" "Jun"
    "Jul" "Aug" "Sep" "Oct" "Nov" "Dec"))

(defun complete-hash (hash)
  (let ((new-hash (make-hash-table)))
    (loop for month-name in (month-list)
          do (if (null (gethash month-name hash))
                 (puthash month-name 0 new-hash)
               (puthash month-name (gethash month-name hash) new-hash))
          finally return new-hash)))

;; Poor man's TSV export
;; TODO check the implicit assertion on the ordering
(maphash (lambda (k v) (insert (format "%s\t%s\n" k v)))
         (complete-hash (pages-per-month)))
Then, for example:
stats <- read.csv("/tmp/stats.tsv", sep = "\t", header = F)
names(stats) <- c("month", "pages")
stats$month <- factor(stats$month, month.name )
p <- ggplot( stats, aes(month, pages)) +
    geom_histogram() +
    theme(axis.text.x = element_text(angle=45, hjust=1))
p
How fast my git repositories are growing
I wrote a very small utility to gather LOC counts from a git repository. Called gitsloc, it's based on Cloc, with some extra goodness provided by Sysadm::Install (a rather inaptly named module, if you ask to me, but full of useful gems).
I guess it could actually have some uses, who knows?, but I wrote it mostly because I wanted to see how fast repos are growing, and R is the obvious tool to tinker with the results.
I'm less than a beginner with R, and I have to admit plotting data
from a multi-column CSV file is less straitghforward than I expected:
I had to use xyplot from the lattice package, like this:
xyplot(
  Perl + Bourne.Shell ~ 1:nrow(sloc),
  data = sloc,
  type = 'a',
  auto.key = list( space = "top", lines = TRUE, points = FALSE)
)
Here the result, with data provided analysing the Dancer github repository (branch devel).
