18 Aug 2015
Measuring things
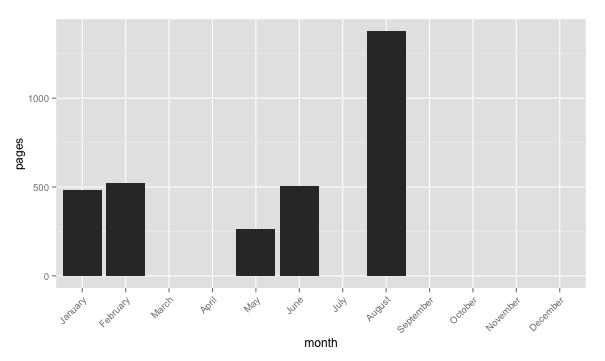
I use org-mode for registering the books I read. Here some code to produce stats.
;; Is there a better (more idiomatic) way to aggregate values?
(defun aggregate (aggregate-function lst)
  (let ((hash (make-hash-table :test 'equal)))
    (loop for key in (mapcar 'car lst)
          for value in (mapcar 'cdr lst)
          do (if (null (gethash key hash))
                 (puthash key value hash)
               (puthash key (funcall aggregate-function value (gethash key hash)) hash))
          finally return hash)))

(defun pages-per-month-raw ()
  (with-current-buffer (get-file-buffer "~/org/books.org")
    (mapcar (lambda (b)
              (let* ((month (format-time-string "%b" (date-to-time (cdr (assoc "TIMESTAMP" b)))))
                     (pages (string-to-int (cdr (assoc "PAGES" b)))))
                (cons month pages)))
            (books/in-year "2015"))))

(defun pages-per-month ()
  (let ((ppmr (pages-per-month-raw)))
    (aggregate '+ ppmr)))

(defun month-list ()
  '("Jan" "Feb" "Mar" "Apr" "May" "Jun"
    "Jul" "Aug" "Sep" "Oct" "Nov" "Dec"))

(defun complete-hash (hash)
  (let ((new-hash (make-hash-table)))
    (loop for month-name in (month-list)
          do (if (null (gethash month-name hash))
                 (puthash month-name 0 new-hash)
               (puthash month-name (gethash month-name hash) new-hash))
          finally return new-hash)))

;; Poor man's TSV export
;; TODO check the implicit assertion on the ordering
(maphash (lambda (k v) (insert (format "%s\t%s\n" k v)))
         (complete-hash (pages-per-month)))
Then, for example:
stats <- read.csv("/tmp/stats.tsv", sep = "\t", header = F)
names(stats) <- c("month", "pages")
stats$month <- factor(stats$month, month.name )
p <- ggplot( stats, aes(month, pages)) +
    geom_histogram() +
    theme(axis.text.x = element_text(angle=45, hjust=1))
p
Tags: